
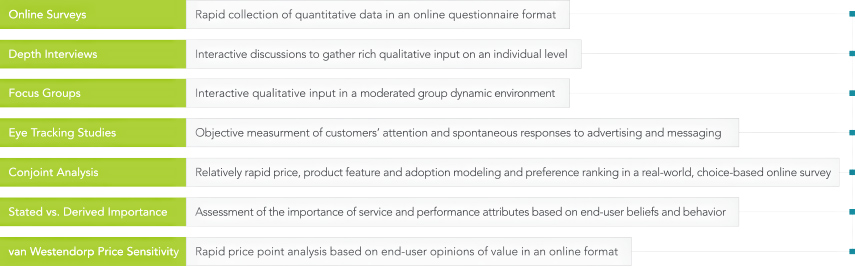
Online Surveys
Rapid access to your targeted global customer base.
When you have questions that demand accurate quantitative analysis, online surveys are the fastest and most effective method for getting the answers you need. By posing well-designed questions to our panel of more than 60,000 life scientists residing in North America, Europe and Asia, you achieve rapid access to feedback from a receptive audience, with the required profile, to meet your projects goals and objectives.
With data in hand, we then draw on our expertise in data analysis and interpretation to provide a level of certainty you can count on. Finally, we compile this data and analysis the final deliverable, a thorough written report providing fact-based answers to your questions as well as our expert take on the implications these answers will have on your business and the market.
The many ways to use online surveys.
Having implemented hundreds of life science online customer surveys, we are skilled in designing questions that are non-biased and unambiguous. Online surveys are ideally suited for the following types of projects:
- Market characterization (market size, competitor shares, growth rates)
- Market needs assessment
- Market segmentation
- Product development / product concept testing
- Customer satisfaction / loyalty surveys
- Advertisement / promotional concept testing
- Brand equity measurement and brand tracking studies
Depth Interviews
Get to know your customers, one-on-one.
One-on-one depth interviews are an effective and powerful qualitative research tool for capturing rich and detailed feedback from key opinion leaders (KOLs) to bench scientists and procurement audiences. Interviews can accommodate a wide range of topics and follow-up questions and are not limited to menu options as in an online survey. In addition, Percepta’s experienced interviewers can go “off script” and easily evolve the discussion if an interesting but unexpected idea is uncovered. In addition, depth interviews are completely flexible; interviews may be scheduled at the convenience of the interviewee, ensuring the best possible contributors to the project.
“At Percepta, the interview quality is outstanding and the interviewers are able to get to the ‘why’ behind the answers because they have a clear technical understanding of what the customer is saying.”
Market Development Manager – Global Research Instrument and Reagent Supplier
Why take the in-depth approach?
Depth interviews are ideal for projects that are exploratory in nature, where understanding customer’s complex perceptions, opinions, beliefs, and attitudes are critical to success. This is in contrast to survey research, where a menu of possible answers can be presented to participants. Depth interviews are also optimal when a precisely targeted group of participants is required, for example, scientists that perform high throughput kinase assays, supply center managers, or perhaps simply bench scientists that perform more than 100 plasmid minipreps per week.
Rely on us. We’ll handle it.
Our considerable experience conducting interviews with scientists ranging from group leaders to lab technicians will provide well-defined, consensus opinions that you can rely on. We will integrate the interview findings and their implications, along with any other data collected, into a comprehensive written report that includes direct quotations from participants that are illustrative of particular points of interest. You have nothing to worry about. We take care of all of the necessary recruitment, scheduling and incentive compensation required.
Focus Group Testing
Capture opinions in a group dynamic.
Focus groups are a valuable research technique for capturing customer feedback in a qualitative fashion from a group of 6 to 12 participants. Like one-on-one interviews, focus group questions are not limited to relatively short answers like an online survey and are easily adapted in real-time by an experienced moderator. However, focus groups have the advantage over interviews in that they are performed in an interactive setting, allowing for collaborative discussion among participants.
Ideal for:
- Testing new product or packaging concepts
- Evaluating new advertisements or promotional materials
- Determining the potential market acceptance of a product with higher certainty
Getting the most actionable data from focus groups.
The first step to successful focus group research involves interviews with the key stakeholders within the client’s company. This enables us to come to a consensus with respect to project goals and objectives as well as desired participant demographics and areas of expertise. Using information gleaned from these discussions, Percepta will craft a customized, comprehensive moderator guide that serves as an outline for the focus group but can be adapted by the moderator if the discussion flow dictates as such.
Percepta handles all of the required scheduling, recruitment, refreshments, and incentive compensation required for a successful focus group. Our considerable experience with group moderation yields clear-cut, consensus customer opinions that deliver the information you require.
Eye Tracking
See your brand through the customer’s eyes.
Eye tracking research objectively measures customers’ attention and spontaneous responses to advertising. The method can observe, record and analyze a respondent’s eye movements as they view a stimulus such as an advertisement. Using this approach we can answer a variety of advertising research questions, including:
- Which ads are the most eye-catching?
- Which elements of an ad tend to be ignored?
- What is the visual flow of the ad?
- Is contact and website information noticed?
- Is branding placed in a visible location?
- Which version of an ad conveys product information most effectively?
- Do audiences view an ad differently?
The findings from an eye tracking research study are supported with statistical analysis of precise visual behavior data and illustrated using gaze replay videos, heat maps and gaze plots. We recommend that interview and questionnaire feedback be incorporated to enhance the richness of the overall results.
Possible applications:
- Print advertising research
- Online advertising research
- Mobile advertising research
- Software user interface research
Incorporate eye tracking into your research and begin designing more eye catching, appealing and memorable advertisements.
Conjoint Analysis
Realism yields accuracy.
Conjoint analysis is a quantitative market research method that is based on the fact that realism yields the most credible data. The method is perfectly suited to market research projects designed to:
- Measure the importance of product features
- Measure preferred performance levels
- Model pricing options
- Model head-to-head adoption scenarios with competing products
Conjoint analysis is most frequently applied in preparation for product design, development and launch.
Define smarter pricing strategies through comparison shopping.
Conjoint analysis employs simulated ‘real-world’ purchasing decisions by asking respondents to select from a group of products as if they were comparison shopping. For example, end-users choose their preferred option from a series of product configurations, each having varying performance levels and prices. For understanding consumer preferences, this is in striking contrast to traditional online surveys, where ratings of product features can often show limited differentiation from feature to feature.
Perhaps the most useful element of conjoint analysis is model market simulation scenarios that yield share of preference for your hypothetical new product versus existing competitor products and prices. Percepta can deliver client-recommended simulations and/or train the client on how to run their own market simulation studies.
Example of Conjoint Analysis Comparison Shopping
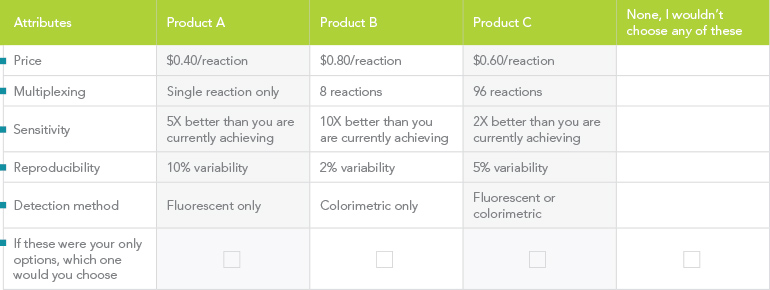
The conjoint analysis survey successively presents multiple pages of product configurations like this example. Participants choose the configuration that best suits their needs
each time or opts to choose “none”. Final statistical analysis and modeling identifies the ideal preferred product configuration based on actual participant choices.
Stated vs. Derived Importance Analysis
You can’t always take the customer at their word.
Almost everyone has participated in a survey that measures stated importance. Maybe you were asked to rate the importance of product features on a scale of 1 to 10, or to rank various attributes from most important to least important. In either case, the simplicity of merely assessing stated importance through this method can often distract us from its limitations, Going by the customer’s word isn’t always enough. Rather, it is their actions that speak the loudest volumes. Helping you perceive the meaning of the latter is where the benefit of stated vs. derived importance analysis lies.
Stated vs. derived importance analysis is a research method that allows marketers to:
- Quantify the importance of brand or product attributes (based on what customers say and do).
- Measure customer satisfaction with their company’s performance on the important metrics in comparison to key competitors.
Since larger sample sizes are needed, stated vs. derived importance analysis is implemented via a targeted online survey.
How to read between the lines.
Derived importance of attributes is measured by correlating each survey respondent’s overall rating of a company with their rating of the company’s performance with respect to each individual attribute. For example, let’s say Company A is rated highly overall by customers, and receives high scores on attributes 1 and 2 but below average marks for attributes 3 and 4. By definition, attributes 1 and 2 have high derived importance and attributes 3 and 4 have low derived importance.
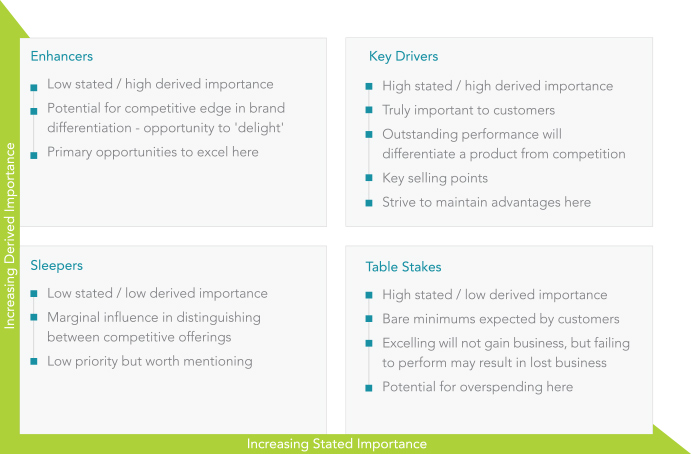
Attributes with both a high stated and high derived importance are key drivers of customer satisfaction. Outstanding performance on these attributes will positively differentiate a product or service from competitor offerings. This table helps drive that point home:
When the stated and derived importance results are plotted, a four-quadrant map emerges:
van Westendorp Price Sensitivity Analysis
A straightforward path to product pricing.
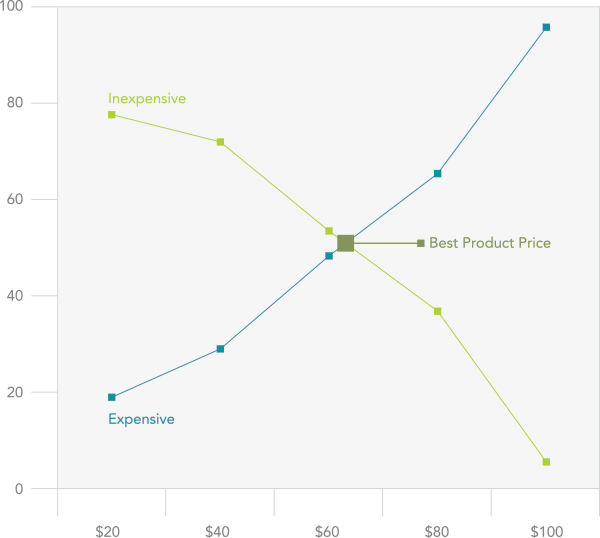
In the 1970s, Dutch economist Peter van Westendorp introduced his Price Sensitivity Meter (PSA), a simple, yet powerful method that incorporates customer’s price perceptions into corporate strategic pricing decisions. The method is based on the assumption that price is a fundamental reflection of value and that customers understand enough about the market landscape to express valid opinions related to acceptable prices for a product or service.
Defining the ideal price, in four simple questions.
The van Westendorp approach relies on the following four price-related questions:
- At what price would you consider the product or service to be so expensive that you would not consider purchasing it? (Too expensive)
- At what price would you consider the product or service to be priced so low that you would question the quality? (Too cheap)
- At what price would you consider the product or service beginning to get expensive, so that you would have to give some serious thought as to whether or not to buy it? (Expensive/On the high side)
- At what price would you consider the product to be a bargain—a great buy for the money? (Reasonable/Good value)
As the graph below illustrates, properly plotting the cumulative frequencies for each question generates an optimal price point and a range of acceptable prices for the product or service of interest. In this way, the relative simplicity of the PSA method allows it to be easily incorporated into a standard online survey and drive your pricing strategy. As an added benefit, van Westendorp analysis is often less expensive than other pricing research methods, such as conjoint analysis, which require complex design and specialized software for implementation and analyses.